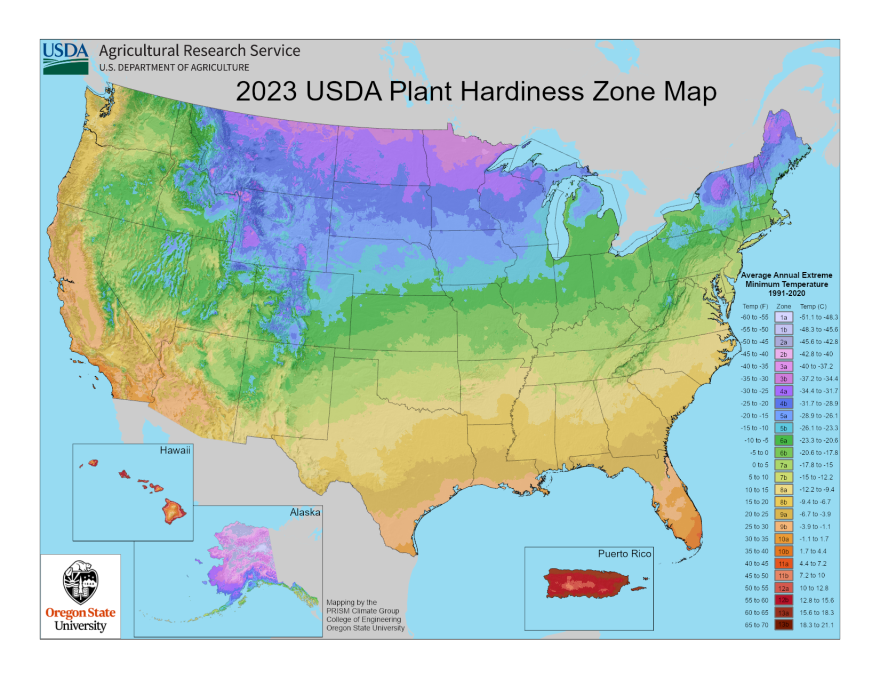
The United States Department of Agriculture updated its Plant Hardiness Zone Map at the end of 2023.
Hardiness zone maps can help you determine what kinds of plants you can plant in your garden. A hardiness zone shows the average annual minimum temperature. If a plant is rated for a zone, it will likely survive the winter there.
The USDA released an updated map in November, using nearly twice the amount of data as the previous map they released in 2012.

The new map uses over 13,000 weather stations’ data from 1991 to 2020. The previous map used just under 8,000 weather stations.
Shital Poudyal, an assistant professor at Utah State University focusing on water conservation and sustainability, said using your plant hardiness zone can help you determine how to plant your yard but they don’t tell the full story.
“Think about where this plant will be going and what kind of support you have for that plant in that location — how much water you can apply, what is the soil type," Poudyal said.
He said each part of your yard has its own microclimate so using additional resources like soil testing, sun intensity, and rainfall can help determine if a plant can survive in your yard.
The map shows a shift toward warmer zones across the country with average temperature increasing by 2.5 degrees. It shows nearly half the country shifting toward a warmer hardiness subzone.
Poudyal said there are a few factors that could account for the shift. “The change is from better data and from the regular climate warming up," he explained.
Poudyal said even though your zone may have shifted, you don’t have to replant your yard.
“That doesn't mean you remove your plants and throw it away. It's fine. They will probably do fine. They will be there. But now when you select a new plant, it's better to go with the new USDA hardiness," Poudyal said.
If you have any questions about what kinds of plants will do well in your yard, Poudyal said experts at the USU Extension can help.
You can find out if the hardiness zone in your zip code has changed using the USDA's comparison tool here.


